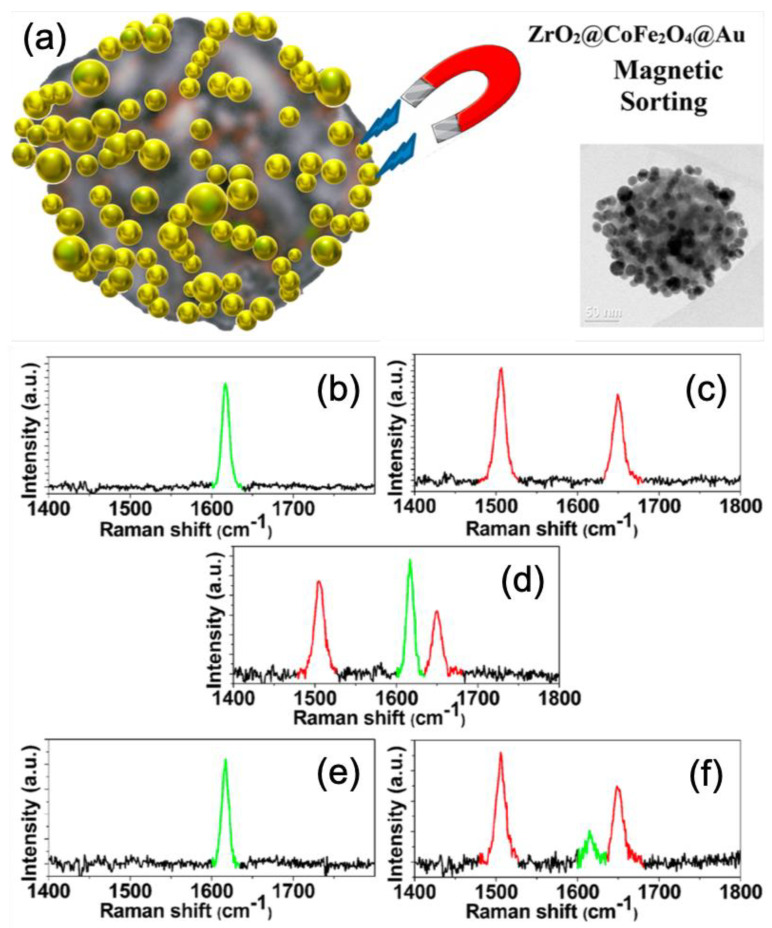
Figure 8.
(a) Scheme and TEM picture of a magnetoplasmonic nanoparticle. SERS spectra of (b) malachite green on magnetoplasmonic NPs, (c) texas red on non-magnetic plasmonic NPs, (d) the mixture of (b) and (c) in solution. (e) SERS spectrum recorded after magnetic attraction from the mixed solution and re-dispersed in water. (f) SERS spectrum recorded after magnetic attraction with the mixed solution. All the figures are reprinted (adapted) with permission from [101], Copyright 2020 American Chemical Society.

