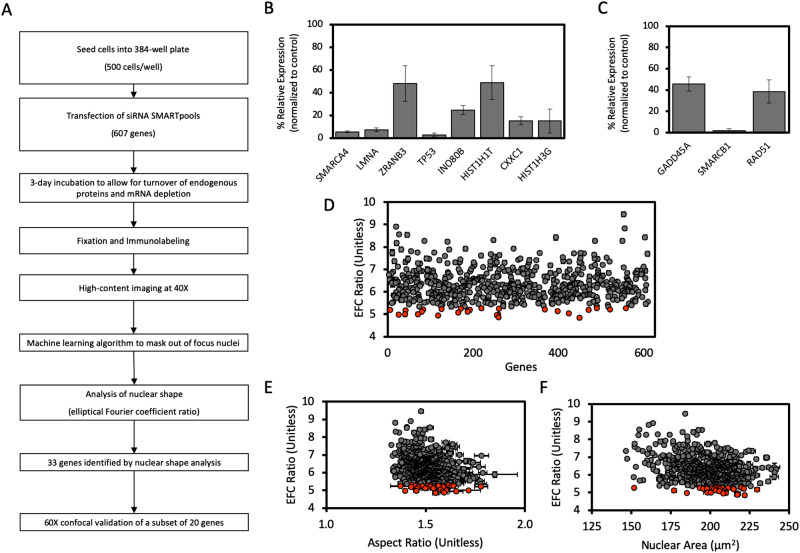
FIGURE 2:
High-throughput nuclear imaging screen identifies epigenetic regulators required for maintenance of normal nuclear shape. (A) Schematic workflow of the siRNA screen for nuclear irregularities. (B) The efficacy of siRNA-mediated knockdown of expression in a subset of genes from the screen identified to significantly decrease EFC ratio, selected randomly, assayed with probe-based RT-qPCR. (C) The efficacy of siRNA-mediated knockdown of expression in a subset of genes from the screen which had no significant effect on EFC ratio, selected randomly, and assayed with probe-based RT-qPCR. Data for both B and C was first internally normalized to GAPDH expression, then externally normalized against a scrambled siRNA negative control, and subsequently analyzed using the 2-∆∆Ct method. Data represent mean of each condition from at least three biological replicates. Error bars represent SEM. (D) Results of the high-throughput screen for nuclear shape showing mean EFC ratio for each gene depletion condition plotted against arbitrary gene number (N = 3, n ≥ 216 for each condition). For D–F, gray data points represent gene depletions determined to have a statistically insignificant effect on the plotted parameter by the two-tailed Bonferroni-corrected nonparametric Dunn’s test; orange data points represent gene depletions which produce significant changes to nuclear shape (p < 0.05; all comparisons relative to the scrambled siRNA negative control). (E) Mean EFC ratio plotted against mean 2-D nuclear X-Y aspect ratio (length of major axis/length of minor axis) for each gene condition in the high-throughput screen (N = 3, n ≥ 216 for each condition). (F) Mean EFC ratio plotted against mean nuclear cross-sectional area (N = 3, n ≥ 216). Error bars represent SEM.

