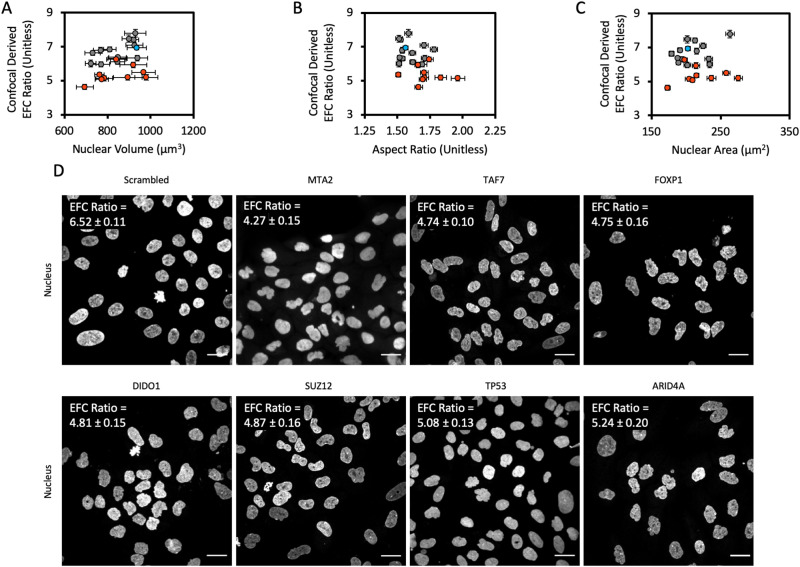
FIGURE 3:
Confocal screen of selected genes from the high-throughput screen. (A) Mean EFC ratio plotted against mean 3-D nuclear volume. Nuclear volume was calculated from 3-D reconstructions created in ImageJ from x-y confocal scans at discrete z-focal planes, as has previously been described (Tocco et al., 2018). (B) Mean EFC ratio plotted against mean 2-D nuclear X-Y aspect ratio. (C) Mean EFC ratio plotted against mean nuclear cross-sectional area for a subset of genes screened by confocal microscopy. Gray data points represent gene depletions which were determined to have a statistically insignificant effect on EFC ratio by the two-tailed Bonferroni-corrected nonparametric Dunn’s test; orange data points represent gene depletions which had a statistically significant effect on EFC ratio (p < 0.05; all comparisons relative to the scrambled siRNA negative control). Blue data point denotes the scrambled siRNA negative control. Error bars are SEM. N = 3, n ≥ 127 for all data shown. (D) Representative images of the nucleus for chosen gene depletions. MTA2, TAF7, FOXP1, SUZ12, DIDO1, T53, and ARID4A were chosen based on statistically significant low EFC ratios caused by the corresponding siRNA transfection in the confocal screen. Scale bar is 25 µm. The EFC ratio in the upper left hand corner of each image panel represents the mean EFC ratio for that gene depletion condition, plus or minus the SEM (N = 3 for all gene depletion conditions; n = 478, 187, 268, 159, 178, 146, 241, and 176 for Scrambled, MTA2, TAF7, FOXP1, SUZ12, DIDO1, T53, and ARID4A, respectively).

