FIGURE 3:
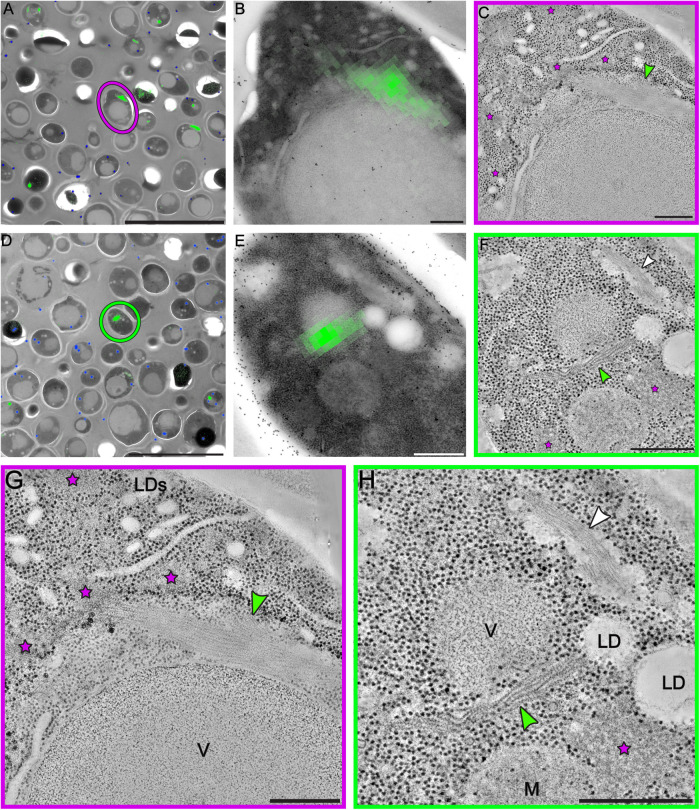
Correlative fluorescence and electron microscopy analysis reveals organization of sfGFP-tagged eIF2B into bundles of parallel filaments. (A, D) The fluorescent signal of sfGFP-eIF2B is overlaid on low-magnification TEM images of energy-depleted yeast cells previously embedded in Lowicryl HM-20 and then sectioned. The magenta circle in A and green circle in D highlight cells that were selected for further tomographic analysis. (B, E) Close-up of the cells highlighted in A and D, respectively. (C, F, G, H) Slices through tomographic reconstructions of the same cells as in B and E. (G, H) Magnified views of the tomographic slices shown in C and F, respectively. Bundles of filamentous structures (green arrows) correspond to the fluorescence signal. eIF2B organizes in ordered, non–membrane bound arrays of filaments. Energy-depleted cells also contain other non–membrane bound compartments that do not include ribosomes. Some have an amorphous appearance (magenta stars), whereas others comprise filamentous structures, H (white arrow). These filaments, which do not display a fluorescent signal, have a different morphology than the eIF2B filaments and their protein content is unknown. LD(s) = lipid droplet(s); M = mitochondrion; V = vacuole. Scale bars: A, D = 10 μm; B, C, G = 200 nm; E, F, H = 500 nm.

