FIGURE 2:
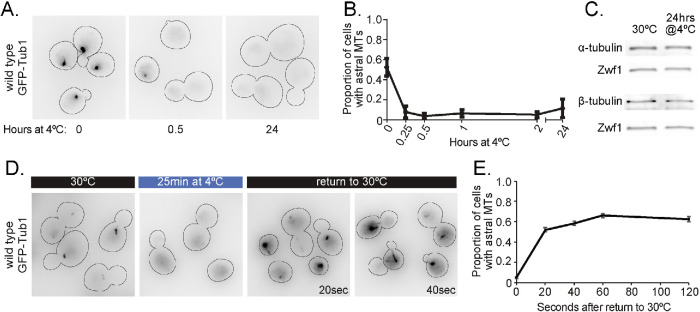
αβ-tubulin levels are maintained at low temperature despite the loss of microtubules. (A) Representative field of wild-type cells expressing GFP-Tub1 shifted from 30°C to 4°C for 0, 0.5, and 24 h. These images use an inverted lookup table to enhance contrast for the GFP-Tub1 signal. (B) Proportion of wild-type cells with astral microtubules present after shifting to 4°C for indicated time. Values are mean ± SEM from at least three separate experiments with at least 420 cells analyzed for each timepoint. (C) Western blot of protein lysate from wild-type cells incubated at 30°C and at 4°C for 24 h, probed for α-tubulin, β-tubulin, and Zwf1 (Glucose-6-phosphate dehydrogenase). (D) Representative field of wild-type cells expressing GFP-Tub1 incubated at 30°C, 25 min after shifting to 4°C, and 20 and 40 s after shifting back to 30°C from 4°C. (E) Proportion of wild-type cells with astral microtubules present after shifting from 4°C to 30°C for indicated time. Each data point represents a proportion calculated from data pooled from three separate experiments with at least 482 cells analyzed for each timepoint. Error bars are standard error of proportion.

