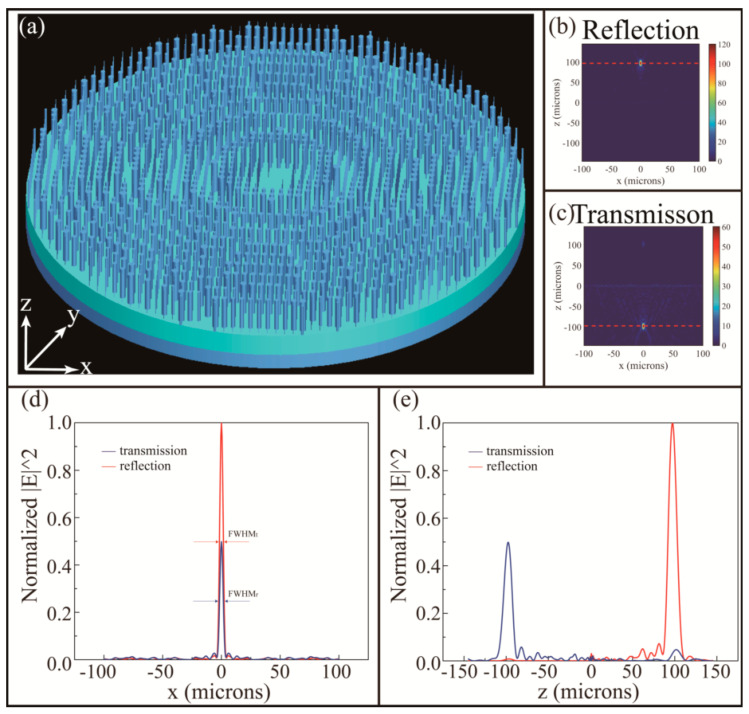
Figure 5.
(a) The array structural diagram of metalens; (b) reflection and (c) transmission electric field strength of far field detection in the xz-plane with the working wavelength 4 µM. The position of focus is indicated by red dotted lines. (d) Normalized distribution of electric field intensity on the focal plane (y = 0) and the arrows indicate the FWHM; (e) normalized distribution of the electric field intensity on the propagation plane (x = 0).

