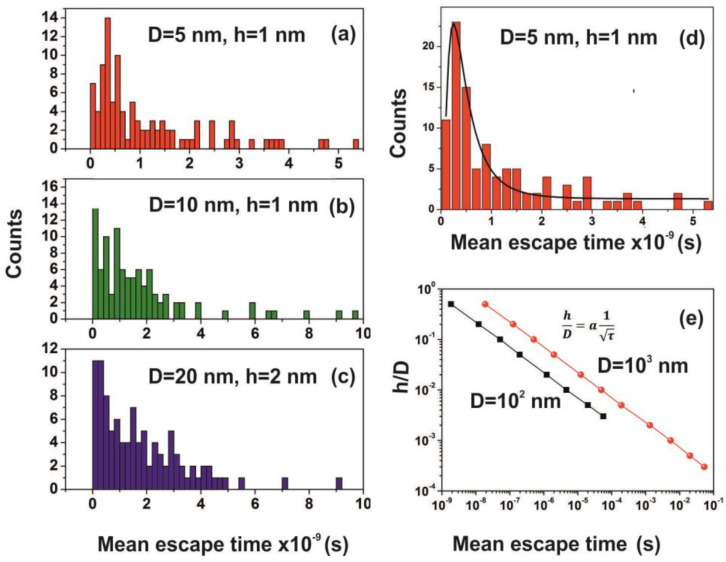
Figure 15.
(a–c) Mean escape time distribution of 150 interactive molecules for different cavity and entrance-escape hole size for 102 runs; (d) best-fitting of Figure 15a is for a log-normal distribution; (e) mean escape time vs. the cavity ratio . The time differentiation of molecular movements inside and outside cavities is provided by the dependence of the ratio on the waiting time τ, which for D=102 and 103 nm cavities goes as a power law of the waiting time with exponent −0.5.

