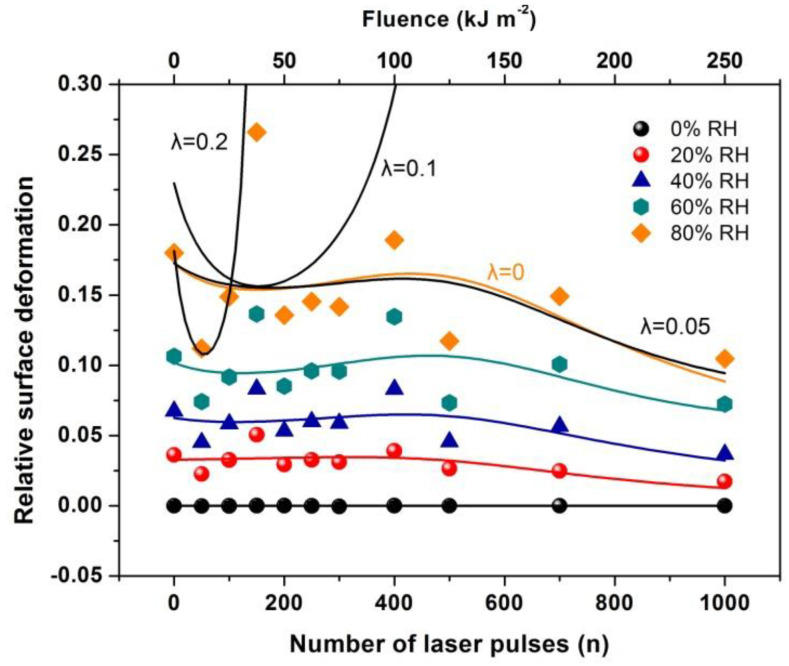
Figure 17.
Relative surface deformation (strain) of the 426 nm polyacrylamide (PAM) layers measured with white light reflectance spectroscopy (WLRS) at different 157 nm irradiating conditions of the PAM matrix and relative humidity (RH). The solid lines at different RH represent the best fit of Equation (36) to the experimental data. The black lines at 80 % RH are the fittings for different λl values of 0, 0.05, 0.1 and 0.2. The best fit (orange line) respectively, is for suggesting a small contribution to the relative surface deformation from electric dipole attachment of water molecules to active binding sites in the PAM matrix and a substantial contribution from the confinement of water molecules in nanocavities, Equation (36).

