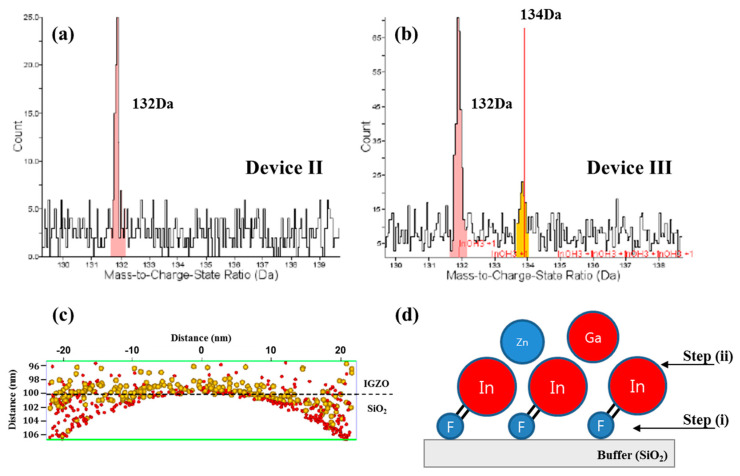
Figure 5.
Mass spectra at the IGZO/buffer (SiO2) interface for (a) device II and (b) device III. (c) Atomic map for device III (132 Da: red, 134 Da: yellow) analyzed with APT (atom probe tomography). (d) InF nanoparticle generation model. The InF formation can be seen in (d); step (i) is F bonding on SiO2 and step (ii) is the formation of InF nanoparticles during the IGZO sputtering process.

