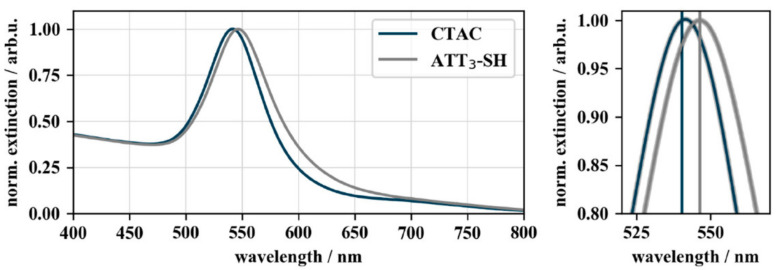
Figure 3.
UV–VIS spectra of CTAC- and DNA-functionalized gold nanocubes. The UV–VIS spectra show the 5.3 nm wavelength shift of the localized surface plasmon resonance (LSPR) peak from 541.2 nm of CTAC-capped (blue) to 546.5 nm of DNA-capped (grey) gold nanocubes. The spectra were normalized to their peak maximum to allow a better comparison of the LSPR shift (ODfinal = 0.26).

