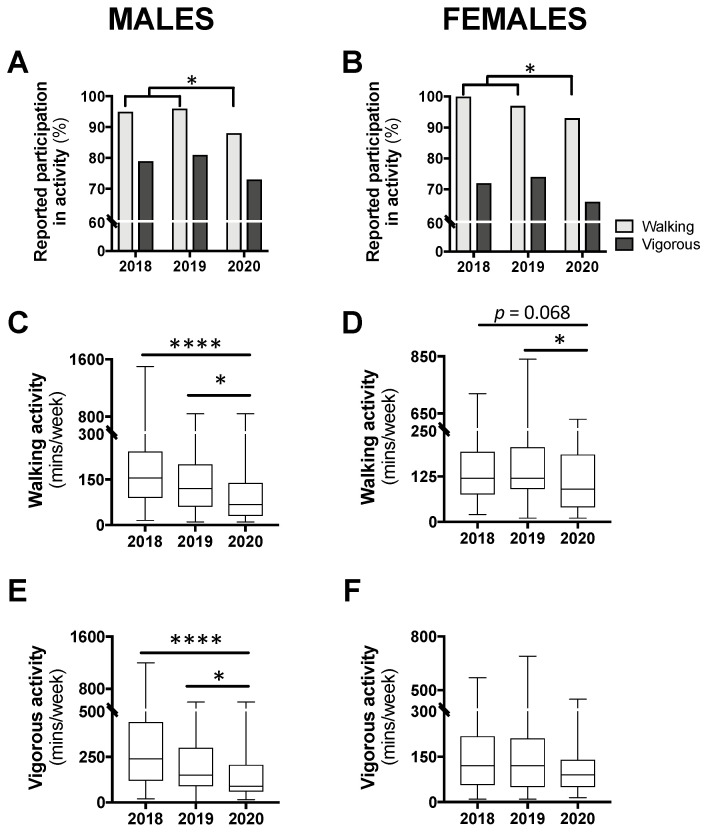
Figure 4.
Levels of participation in physical activity (A,B) and time spent in walking (C,D) or vigorous activity (E,F) in class year 2020 (n = 66 males, 83 females) compared with 2018 (n = 61 males, 97 females) and 2019 (n = 73 males, 104 females). Data are presented as the proportion of students included in this analysis each year (A,B), or median ± IQR and range (C–F). For (A,B), no statistical differences were observed between 2018 and 2019 and, therefore, to meet the assumptions of the chi-square test, these years were combined and compared with 2020; * p < 0.05 between 2020 and 2018/2019 by chi-square test. For (C–E), * p < 0.05 between 2020 and 2019 and **** p < 0.0001 between 2020 and 2018 by Kruskal–Wallis test.

