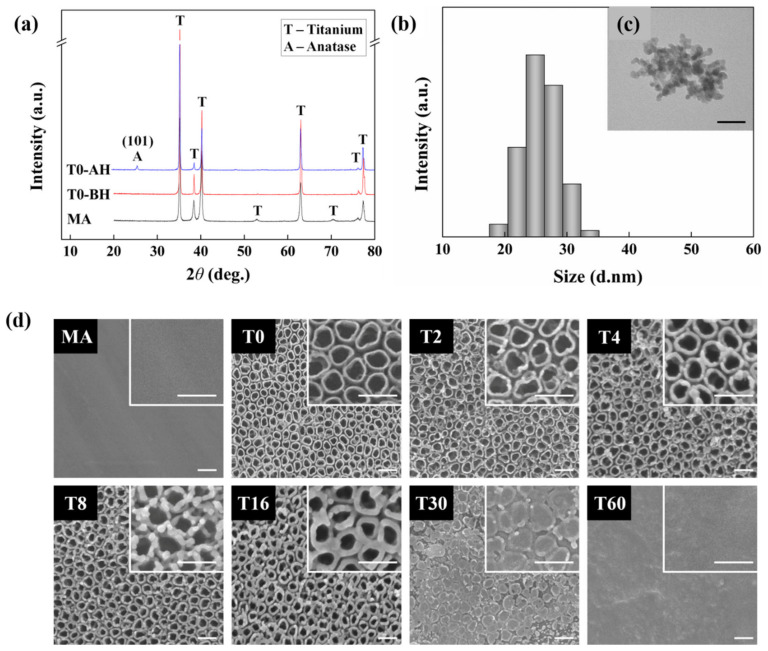
Figure 2.
Surface characterization of control and test specimen. (a) XRD spectra of machined Ti (MA), non-heat-treated T0 (T0-BH) and T0 heat-treated at 450 °C (T0-AH), characterization of electrospray-deposited tetracycline nanoparticles by (b) dynamic light scattering for the nanoparticle size and (c) transmission electron microscopy for the surface morphology of the nanoparticles (scale bar = 100 nm), and (d) surface morphology of the specimens assessed by FE-SEM (top view) (scale bar = 200 nm).

