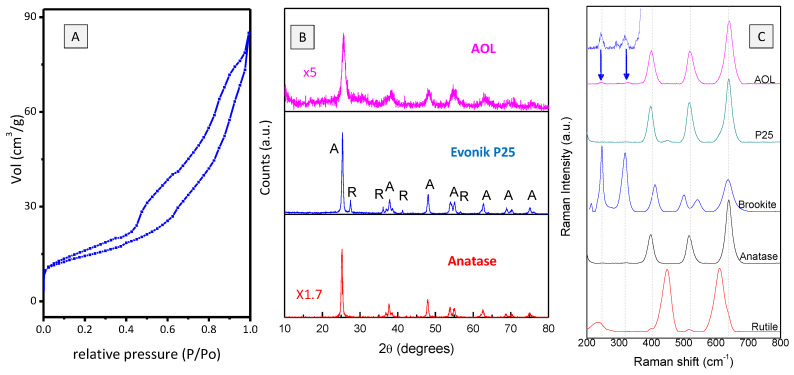
Figure 5.
Characterization of AOL. (A) Nitrogen adsorption-desorption isotherm. (B) XRD pattern. Those patterns of Evonik P25 and Anatase have also been included for comparison. Anatase (A) and Rutile (R) peaks are marked for Evonik P25. (C) Raman spectra. For comparative purposes, spectra of brookite and rutile reference materials have also been included. Spectrum of brookite was obtained from RRUFF database (https://rruff.info/brookite/) whereas that of rutile corresponds to a reference material from Sigma-Aldrich (Sigma-Aldrich, Darmstadt, Germany).

