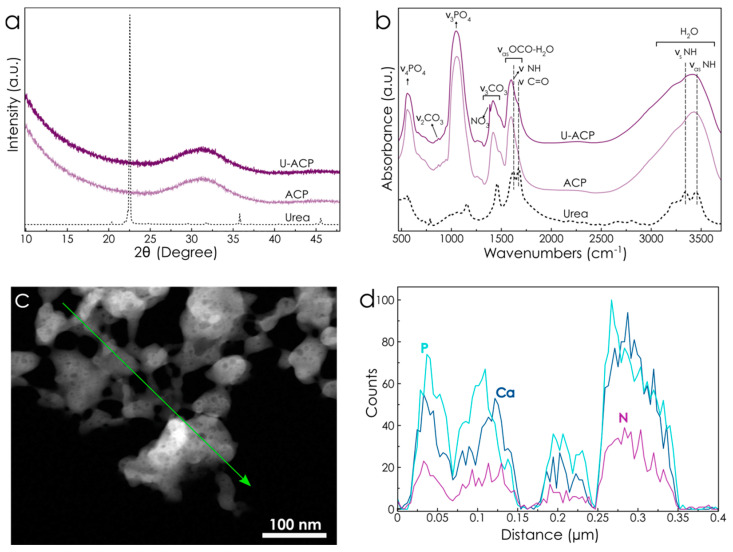
Figure 2.
Structural and compositional characterization of U-ACP. XRD patterns (a) and FTIR spectra (b) of crystalline urea (dotted line), non-doped ACP nanoparticles and U-ACP nanocomposite. High-angle annular dark-field (HAADF) image (c) and line profile energy-dispersive X-ray spectroscopy (EDS) of U-ACP nanoparticles showing the Ca Kα (dark blue curve), P Kα (light blue), and N Kα (magenta) signals (d).

