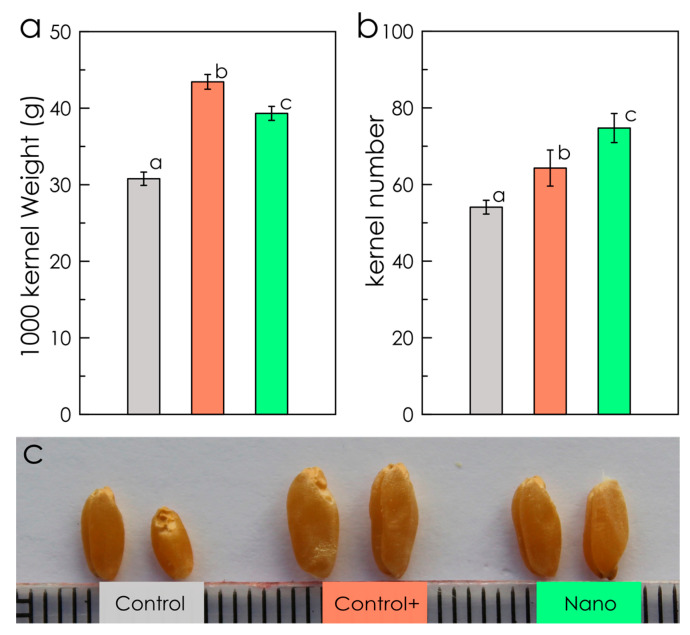
Figure 4.
Yield parameters of durum wheat. Average thousand-kernel weight (a) and total kernel number (b) per plant. Data are expressed as average with the corresponding standard error as bars (n = 3). Different letters indicate significant differences between the treatments (p ≤ 0.05). Representative picture showing the kernel size of the different treatments (c).

