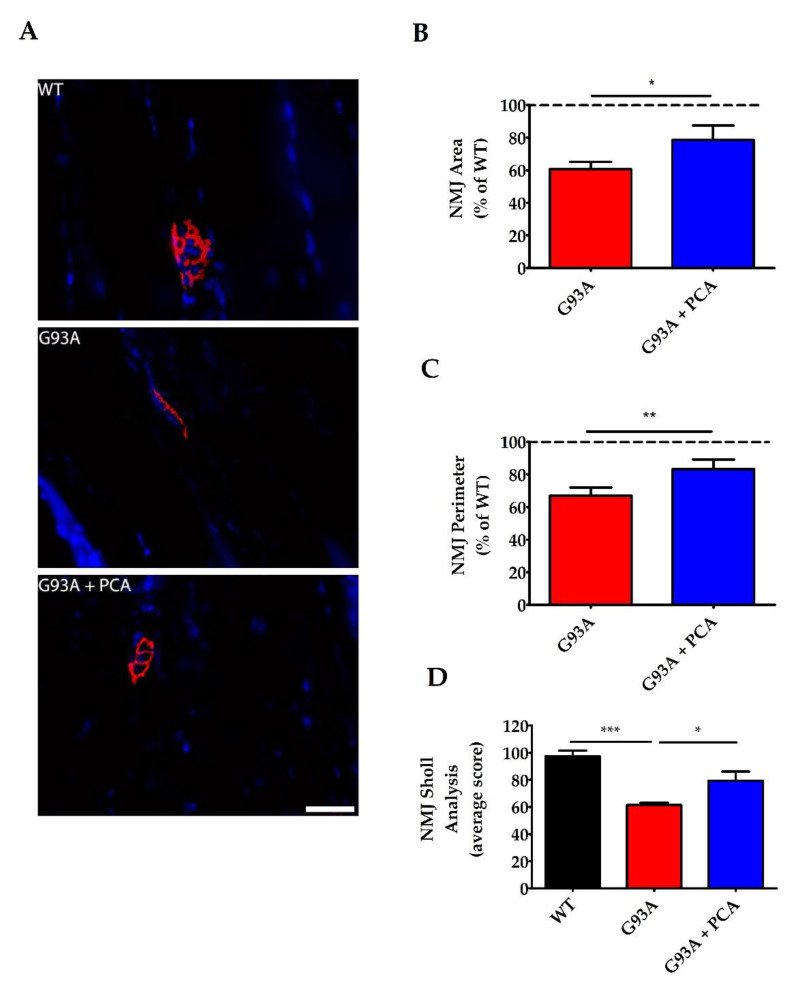
Figure 8.
PCA treatment significantly preserves neuromuscular junctions (NMJ) in the gastrocnemius muscle in the hSOD1G93A mouse model of ALS. (A) Representative images of gastrocnemius muscle from wildtype control mice (WT), untreated hSOD1G93A mice (G93A), and hSOD1G93A mice treated orally with 100 mg/kg PCA beginning at disease onset (G93A+PCA). Mice were euthanized at end stage of the untreated hSOD1G93A littermate mouse and gastrocnemius muscles were stained with alpha-BTx (red) and Hoechst (blue) to label NMJs and nuclei, respectively. Scale bar = 40 μm. (B) Quantification of gastrocnemius NMJ area stained with alpha bungarotoxin as described in A. The NMJ area, measured in pixels by tracing the outside of the neuromuscular junction, of untreated and PCA-treated hSOD1G93A littermate mice were normalized and expressed as a percentage of NMJ area measured in the WT littermate control mouse. Data are expressed as the mean ± SEM; n = 8 mice per group; 20–25 NMJs were imaged per mouse. * indicates p < 0.05 compared to untreated hSOD1G93A control mice (paired t-test). Mean NMJ pixel area for the untreated hSOD1G93A littermate mouse (11,842 ± 1204) is significantly less than the WT littermate control mouse (17,966 ± 818) (p = 0.01; n =8 mice per group). (C) Quantification of gastrocnemius NMJ perimeter stained with alpha bungarotoxin as described in A. The NMJ perimeter, measured in pixels by tracing the inside and outside of the NMJ, of untreated and PCA-treated hSOD1G93A littermate mice were normalized and expressed as a percentage of NMJ perimeter measured in the WT littermate control mouse. Data are expressed as the mean ± SEM; n = 9 mice per group; 20–25 neuromuscular junctions were imaged per mouse. ** indicates p < 0.01 compared to untreated hSOD1G93A controls (paired t-test). Mean NMJ pixel perimeter for the untreated hSOD1G93A littermate mouse (730.9 ± 39.37) is significantly less than the WT littermate control mouse (1141 ± 94.52) (p = 0.0007; n = 9 mice per group). (D) Quantification of gastrocnemius NMJ Sholl analysis stained with alpha bungarotoxin as described in A. WT, untreated, and PCA-treated hSOD1G93A littermate mice were given a mean Sholl analysis value, which represents the number of intersections that the NMJ makes with concentric circles every 10 pixels from a center point. Data are expressed as the mean ± SEM; n = 8 mice per group; 20–25 neuromuscular junctions were imaged per mouse. * indicates p < 0.05 and *** indicates p < 0.001 compared to WT littermate control mice (one-way ANOVA with post-hoc Tukey’s test).

