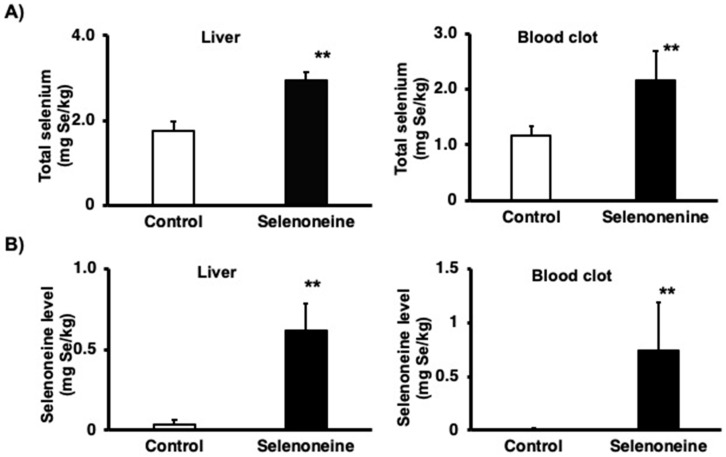
Figure 3.
Total selenium and selenoneine concentration. (A) Total selenium level. (B) Selenoneine level. Mice were fed a diet supplemented with 0.3 mg Se/kg selenoneine for 4 months. The total selenium and selenoneine concentrations were measured using LC-ICP-MS. Values are presented as mean ± SD (n = 8). Significant differences were assessed using Student’s t-test (**, p < 0.01).

