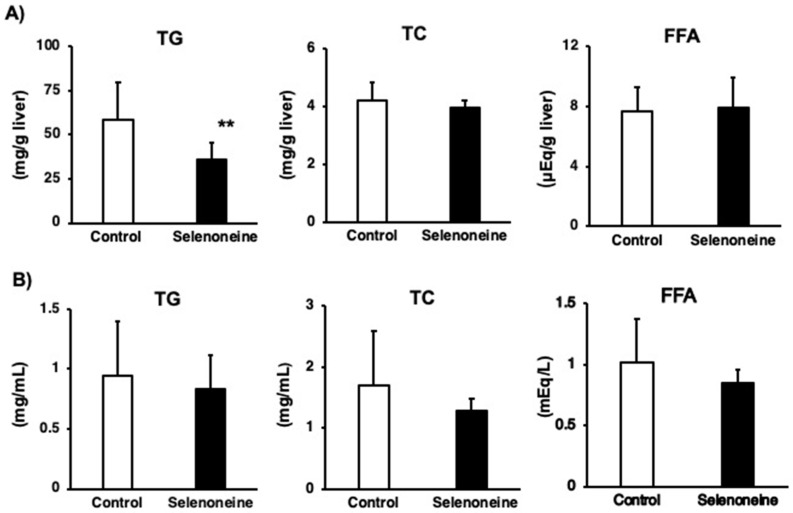
Figure 7.
Changes in hepatic and serum lipid levels. (A) Hepatic lipid levels. (B) Serum lipid levels. Mice were supplemented with 0.3-mg Se/kg selenoneine for 4 months. Values are presented as mean ± SD (n = 8). Significant differences were assessed by the Student’s t-test (**, p < 0.01 vs. corresponding control mice). TG, triglyceride; TC, total cholesterol; FFA, free fatty acid.

