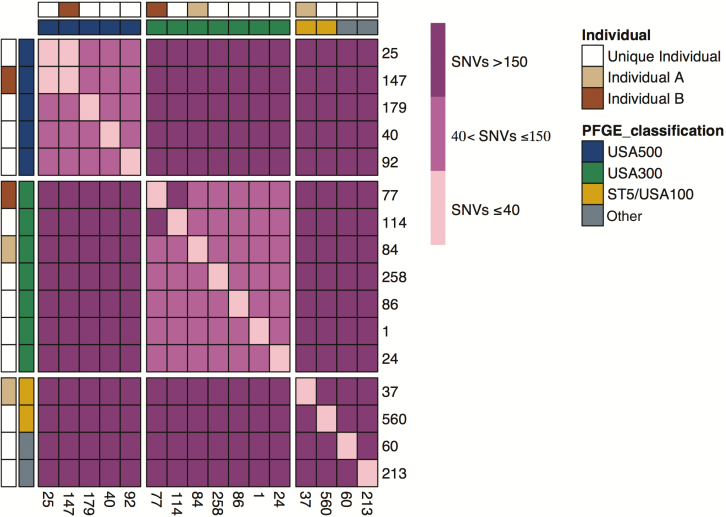
Figure 1.
Genomic epidemiology of methicillin-resistant Staphylococcus aureus (MRSA) isolates from clinic A. The number of SNVs between all pairs of MRSA isolates from MRSA-positive individuals who received care at clinic A are displayed as a heat map. The rows and columns show the 16 MRSA isolates from the 14 individuals who received care at clinic A. Column and row annotations indicate the strain of the isolate (USA300, USA500, or ST5) and whether an isolate was from 1 of the 2 individuals colonized with multiple strains (individuals A and B). Abbreviations: PFGE, pulsed-field gel electrophoresis; SNV, single nucleotide variant.

