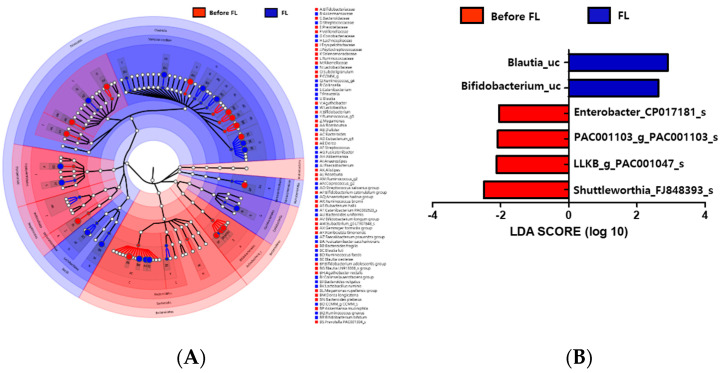
Figure 3.
Genus level distribution and LEfSe analysis revealed differences in the gut microbiota between the before FL and FL groups. (A) A cladogram of taxonomic differences between the before FL (red) and flavonoid-low orange cordial (FL; blue) groups. (B) Significant bacterial differences were observed in the before FL (red) and FL (blue) groups. The significant threshold of the LDA score is >2; taxonomic compositions in the FL group are indicated with a positive LDA (blue), and enriched taxonomic compositions in the before FL group are indicated using a negative LDA score (red).

