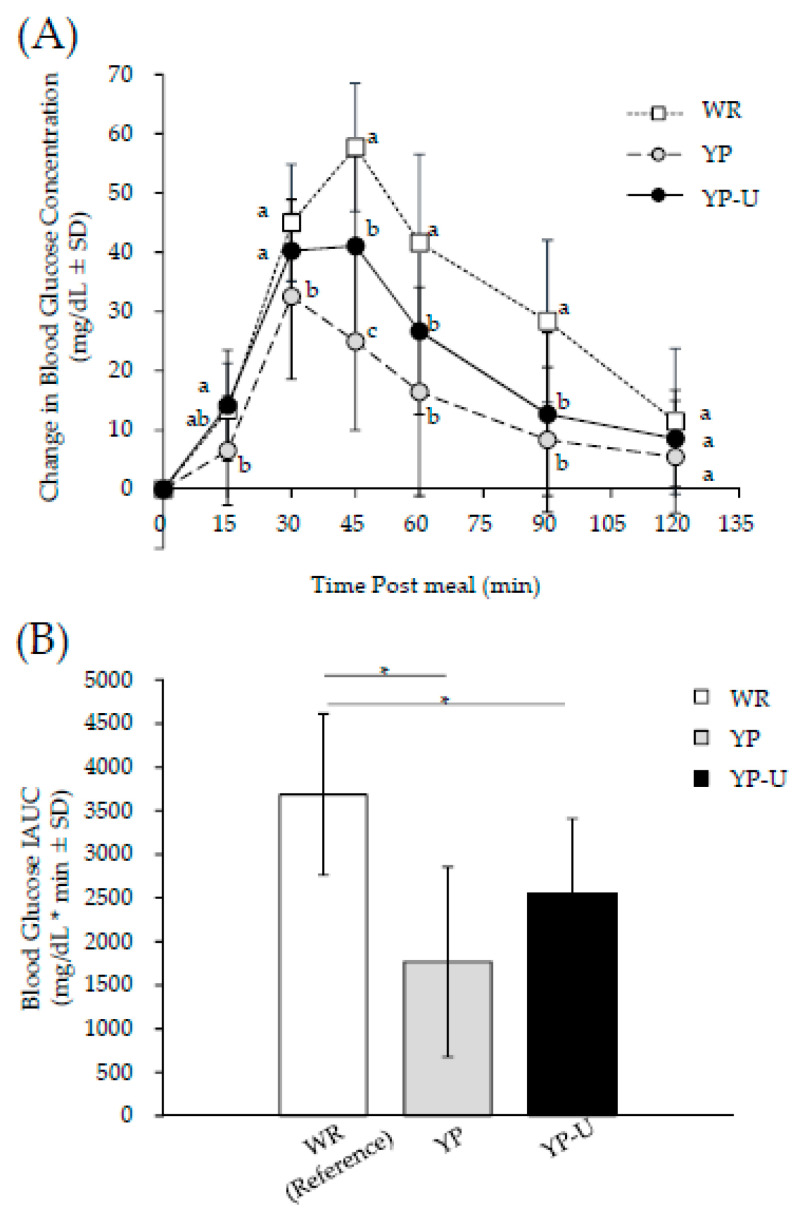
Figure 3.
Changes of postprandial glycemic response and blood glucose IAUC. (A) For changes in postprandial blood glucose concentration. Different alphabets indicate significant differences; p < 0.05 (Bonferroni correction). (B) For blood glucose IAUC. * Significant difference between the comparison; p < 0.05 (Bonferroni correction). All data are means ± SD of 12 subjects.

