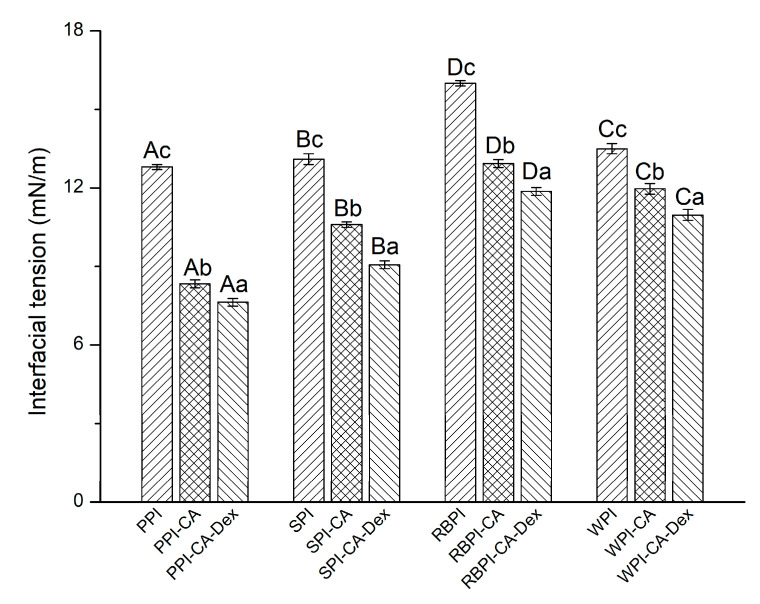
Figure 3.
The interfacial tensions of NP, PC, and PCD samples. A–D represented that there were statistically differences (p < 0.05) in interfacial tensions among nanoemulsions stabilized by four NPs, four PCs, or four PCDS, a–c represented that there were statistically differences (p < 0.05) among NP, PC, and PCD in same proteins.

