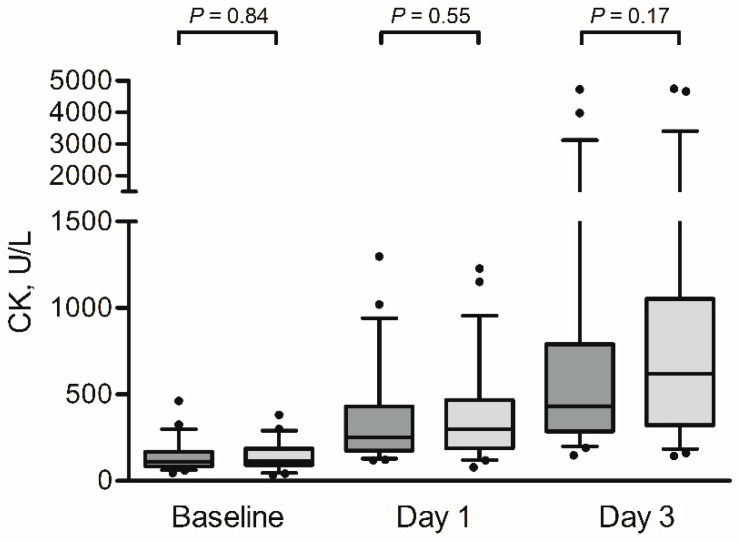
Figure 3.
Box-and-whisker plots for creatine kinase (CK) at baseline, after day 1 and after day 3. The box-and-whisker plots represent the median, interquartile range, 5–95% percentile (upper and lower whiskers) and outliers (dots) of creatine kinase (CK) for the protein group (dark grey) and the placebo group (light grey). Prolonged walking resulted in elevated CK levels in both groups (p < 0.001). No significant differences were observed between the groups at the different time points (all p > 0.05).

