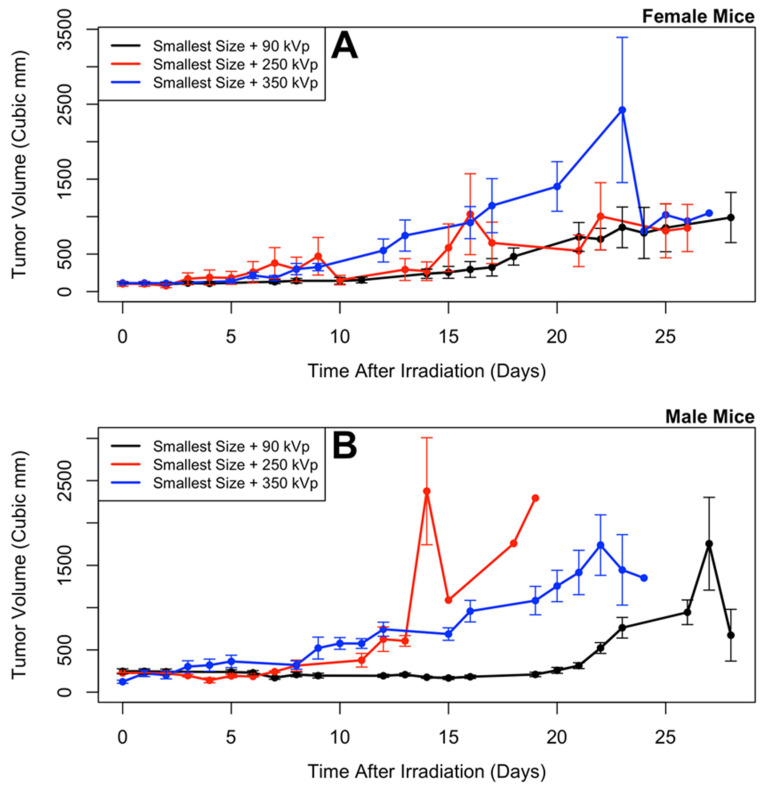
Figure 5.
Tumor size versus time, for different radiation energies, in female (A) and male (B) mice. Mean and standard error of the mean are plotted; points without error bars came when only one mouse was left alive in a treatment group. Statistical analyses of these results indicate that lower energies produce the smallest tumors.

