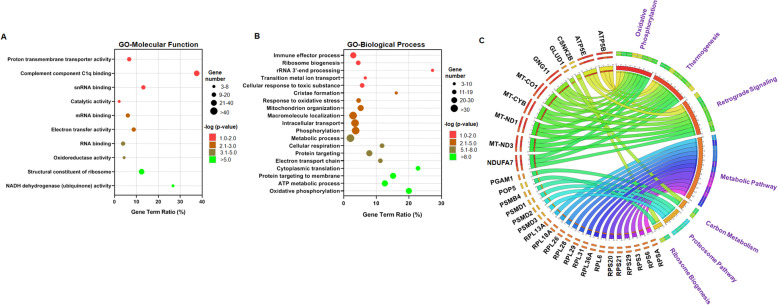
Fig. 4.
Functional annotation clustering identifies subsets of metabolic genes specific to chondroclasts. GO analysis of genes upregulated in chondroclasts for molecular function (a) and biological process (b). The top enrichment pathways were shown in the advance bubble chart. Y-axis label represents pathway, and X-axis label represents gene term ratio (gene term ratio = gene numbers annotated in this pathway term/all gene numbers annotated in this pathway term). Size of the bubble represents the number of genes enriched in the GO terms, and color showed the FDR P value of GO terms. c KEGG pathway enrichment analysis of chondroclast-specific genes was represented by Circos plot. The associated genes and KEGG pathways are indicated outside the circle

