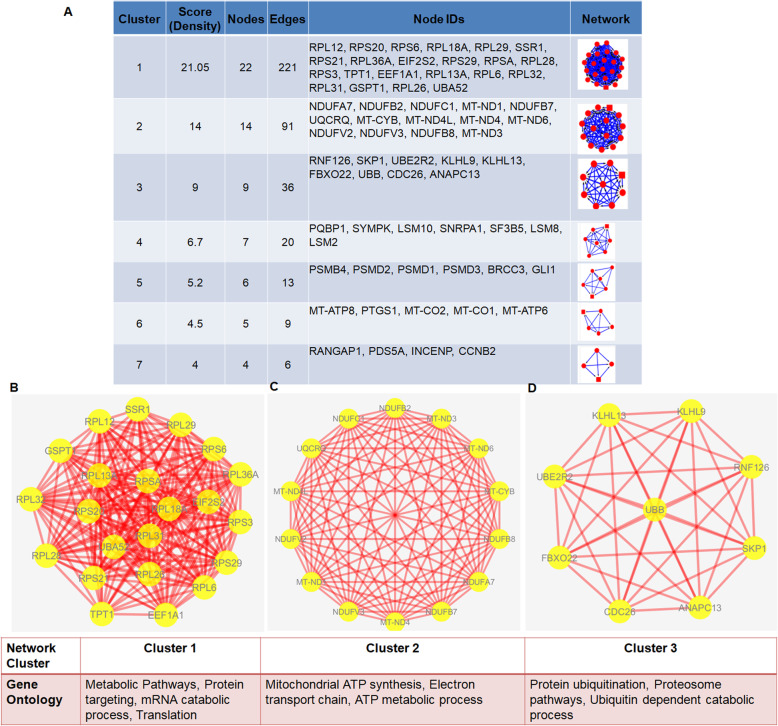
Fig. 5.
Network analysis reveals the abundance of structured networks of metabolic pathways, ATP synthesis, and proteasome pathways in chondroclasts. PPI network of genes upregulated in chondroclasts was constructed using STRING database utilizing experimentally validated interactions with a combined PPI score of > 0.7. Subnetwork analysis in the PPI network using MCODE identified the significant modules/clusters. a The cluster analysis in PPI network resulted in 10 clusters. Top 7 clusters were shown which include 67 nodes and 396 edges. Cluster 1 (b), cluster 2 (c), and cluster 3 (d) of top three network clusters in the subnetwork analysis of PPI network of IDD-related genes and enriched GO terms for biological processes were shown. The cluster networks were visualized by Cytoscape (version 3.7.1). All nodes are significantly enriched at FDR P value < 0.05

