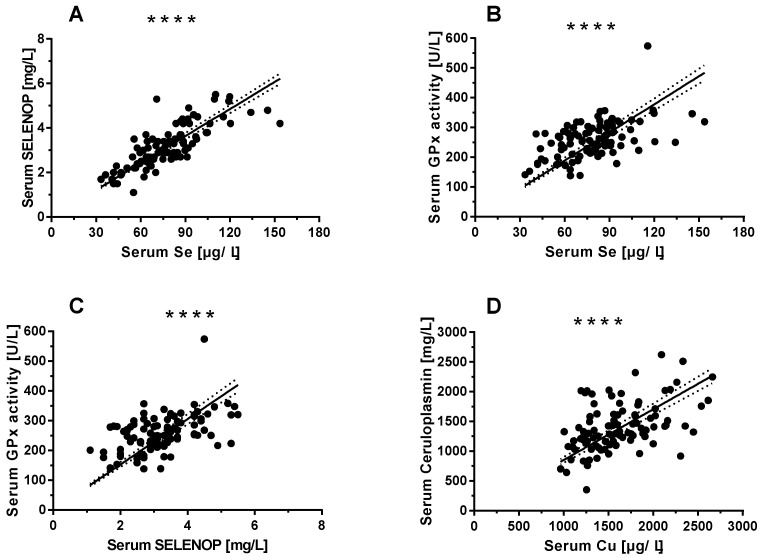
Figure 1.
Selenium (Se) and Copper (Cu) status assessment from serum of the full study cohort. The concentrations of biomarkers of Se status correlate significantly in the serum samples analysed, and positive and tight correlations are observed for (A) selenoprotein P (SELENOP) and total Se (n = 96 pairs of data, r = 0.792, p < 0.0001), (B) GPx3 activity and total Se (n = 96, r = 0.491, p < 0.0001), as well as (C) GPx3 activity and SELENOP (n = 96, r = 0.470, p < 0.0001). (D) Similarly, both biomarkers of Cu, i.e., ceruloplasmin (CP) and total Cu concentrations show a positive and tight correlation across the full range of values in the complete cohort of serum samples (n = 96, r = 0.475, p < 0.0001). Correlations were analysed by Spearman’s correlation test. p-values < 0.05 were considered statistically significant; **** indicates p < 0.0001.

