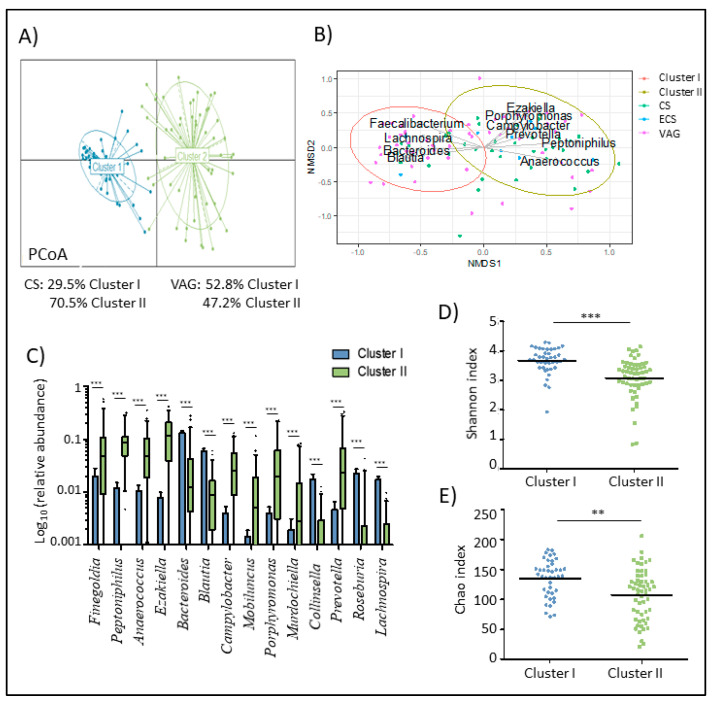
Figure 1.
Maternal microbiota was clustered in two groups based in their composition and diversity at delivery. (A) Principal coordinate analysis (PCA) of maternal microbiota at delivery according to the cluster at the genus level. (B) Non-metric multidimensional scaling (NMDS) of the maternal microbiota at delivery time at amplicon sequence variant (ASV). Arrows show the genus loadings for each cluster. the color of the points expresses the delivery mode group of the mother. (C) Boxplot of the main genera that marked the difference of the maternal microbiota composition between both clusters. Data was transformed by log10 of the relative abundance of each genus for plotting. Whiskers represent the 5-95 percentile interval. (D,E) Differences in the diversity (D) and richness (E) of maternal microbiota based on the Shannon index according to the cluster. Line represents the median of each group. * p < 0.05. ** p < 0.01. *** p < 0.001.

