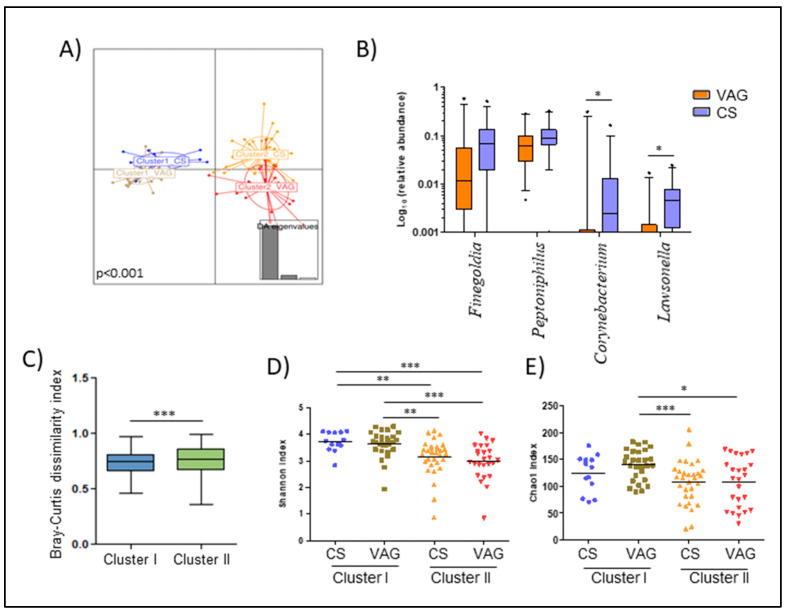
Figure 3.
Maternal microbiota at delivery is dissentingly shaped by the delivery mode. (A) Discriminant analysis of principal components (DAPCs) of the maternal microbiota according to the variable that resulted from the combination of the cluster and delivery mode. (B) Boxplot of the main genera that marked the difference of the maternal microbiota composition between delivery modes in mothers classified as cluster II. Data was transformed by log10 of the relative abundance of each genus for plotting. Whiskers represent the 5–95 percentile interval. (C) Bray-Curtis dissimilarity index within mothers that had both vaginal and C-section delivery according to the cluster classification. (D,E) Differences in the maternal microbiota diversity (D) and richness (E) based on the Shannon and Chao1 index, respectively, according to the variable that resulted from the combination of the cluster and delivery mode. The line represents the median of each group. * p < 0.05. ** p < 0.01. *** p < 0.001.

