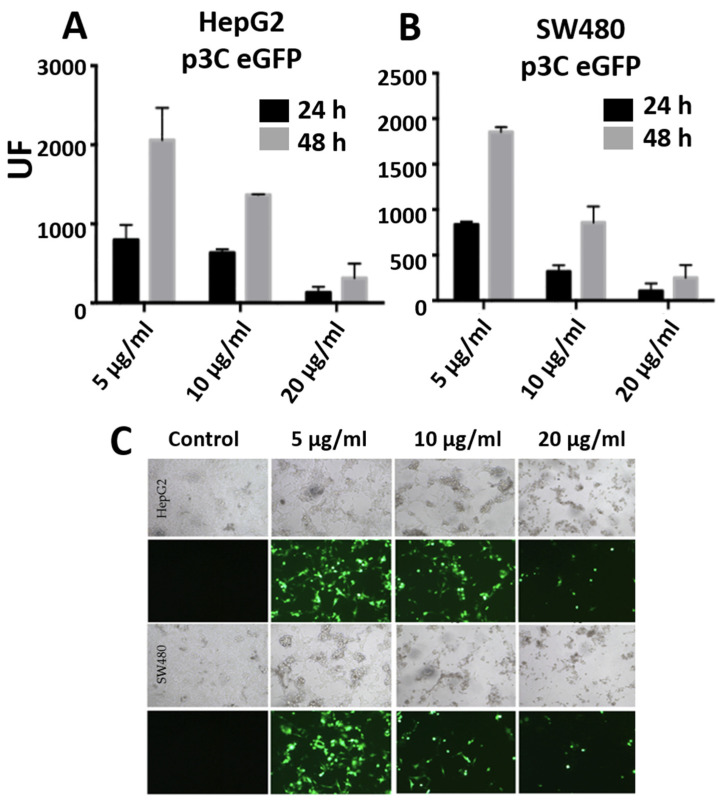
Figure 2.
Graphs (A,B) represent fluorescence of HepG2 and SW480, respectively, 24 and 48 h after transfection with PEI-AuNPs/p3C eGFP with 5, 10 or 20 µg/mL of p3C eGFP at a relation of PEI-AuNPs/p3C eGFP of 1:2.5 (µg/µg). Figure (C) shows the fluorescence microscope images of HepG2 and SW480 cells 48 h after transfection with PEI-AuNPs/p3C eGFP at 1:2.5 (µg/µg) using different DNA concentrations. Images were captured at 20× magnification.

