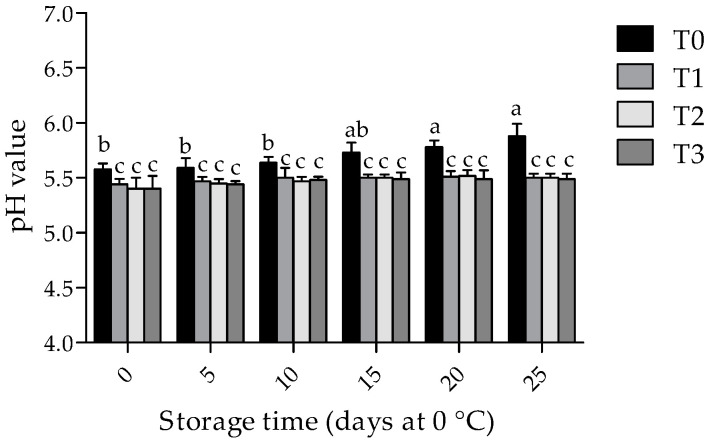
Figure 1.
Effect of chitosan with GTWE and storage time on pH values of meat samples. Values expressed as mean ± standard deviation. T0 (non-coated chops and without GTWE); T1 (chitosan-coated chops without GTWE); T2 (chitosan-coated chops plus 0.1% of GTWE); and T3 (chitosan-coated chops plus 0.5% of GTWE). Different superscripts (a–c) indicate significant differences among treatment × storage time values (p < 0.05).

