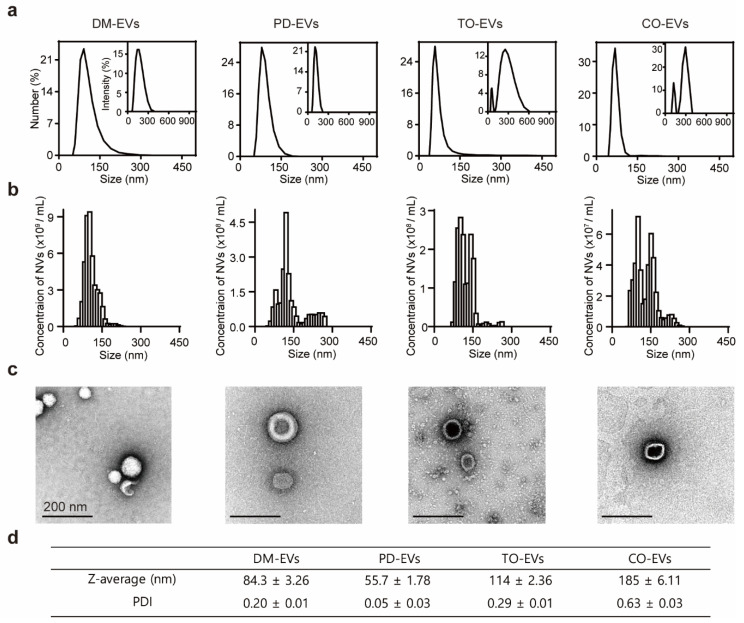
Figure 1.
Characterization of plant sap-derived extracellular vesicles (EVs). (a) dynamic light scattering (DLS) measurements of particle size frequency distribution for DM-EVs, PD-EVs, TO-EVs, and CO-EVs. Insets: Intensity size distribution curves. (b) Nanoparticle tracking analysis (NTA) measurements of concentration and size distribution for DM-EVs, PD-EVs, TO-EVs, and CO-EVs. (c) TEM images of DM-EVs, PD-EVs, TO-EVs, and CO-EVs. DM, Dendropanax morbifera; PD, Pinus densiflora; TO, Thuja occidentalis; CO, Chamaecyparis obtusa. Scale bar: 200 nm. (d) Plant sap-derived EVs measured by Z-average and polydispersity index (PDI).

