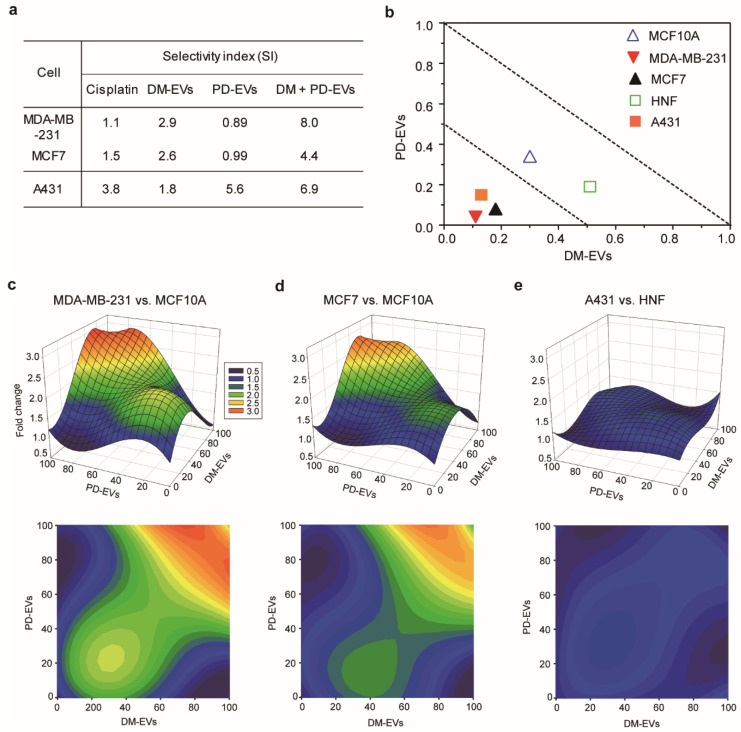
Figure 5.
Selective index for combined treatment with DM-EVs and PD-EVs against breast and skin tumor cells. (a) Selective index for cisplatin, DM-EVs, PD-EVs, and the combination of DM-EVs and PD-EVs. (b) Isobologram curve at the 50% cell viability level for each cell type. (c–e) Selective toxicity toward malignant cells relative to normal cells, measured as fold-difference in cell survival using 3-dimensional response plots. (c) MDA-MB-231 versus MCF10A; (d) MCF7 versus MCF10A; (e) A431 versus HNF.

