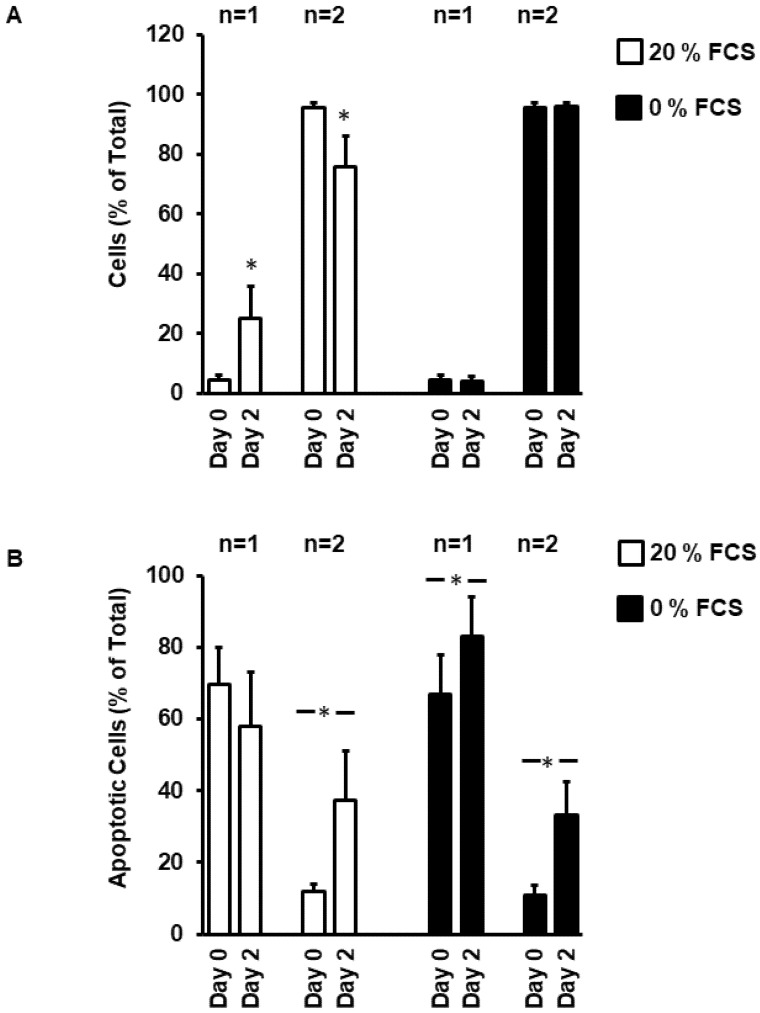
Figure 4.
Ratio between mono (n = 1) and binucleated (n = 2) cells at day 0 and 2 in the presence and absence of fetal calf serum (A). Number of cells undergoing apoptosis (identified by DNA condensation—see Figure 1) under these conditions (B). Data are means ± SD from n = 8 preparations (237–410 cells per preparation). (*, p < 0.05 vs. Day 0)

