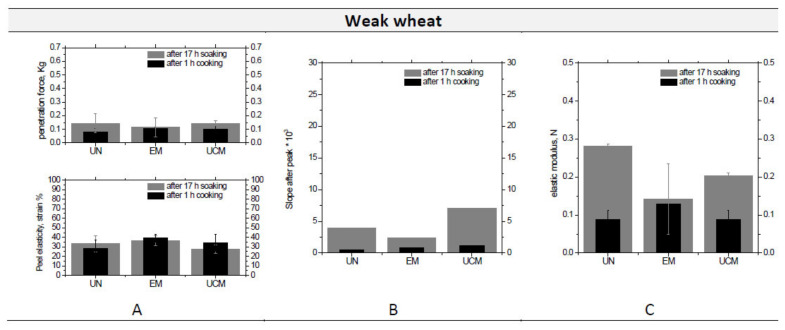
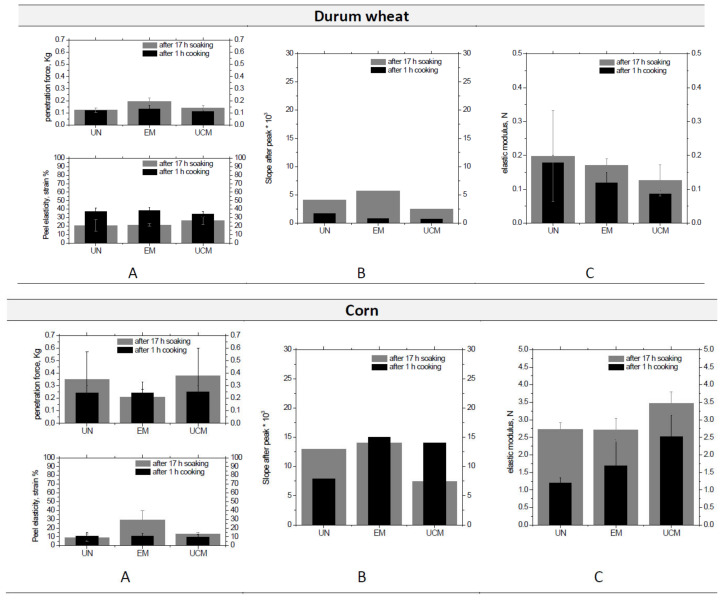
Figure 4.
Penetration and compression tests results for the three analyzed matrices: comparison of the penetration force and the relevant strain % (A) and the slope after the peak (B) for the penetration test, and of the elastic modulus (C) for the compression test between samples after 17 h swelling and 1 h cooking.


