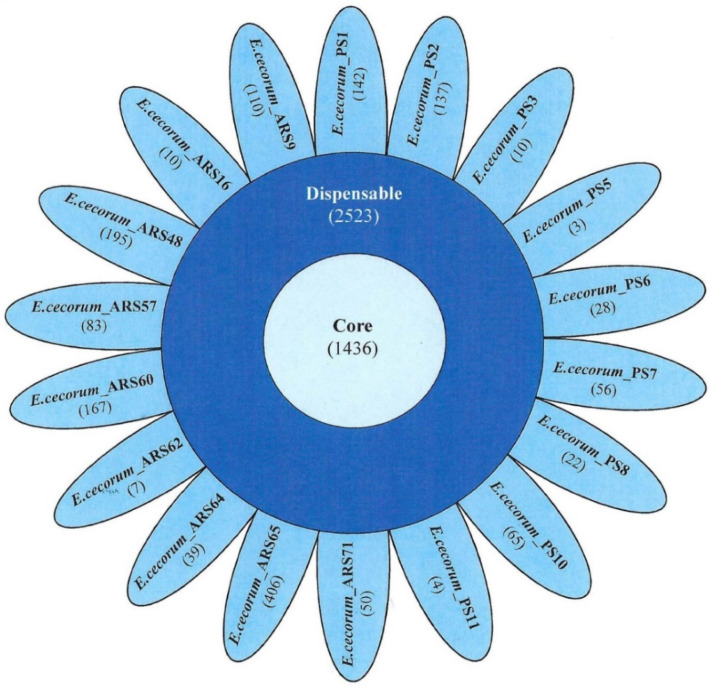
Figure 1.
Venn diagram showing the pan-genome of 18 Enterococcus cecorum clinical (PS) and non-clinical (ARS) isolates from chicken. The number of core genes is the number of common genes shown in the center, while genes common between isolates are shown in the periphery (accessory genes). Each petal represents the unique genes in the respective isolates.

