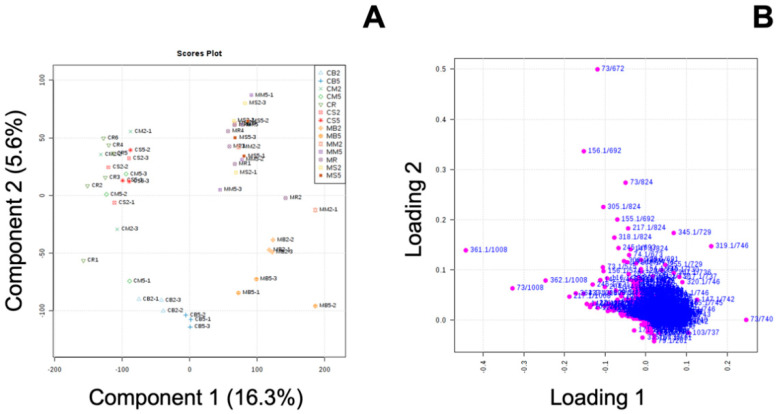
Figure 5.
Partial least-square discrimination analysis score plot (A) and loading plot (B) derived from raw (control raw: CR; methyl jasmonate-treated raw: MR) and cooked control and methyl jasmonate-treated broccoli samples. The first letter, C or M, indicates the control or methyl jasmonate-treated group. The second letter, B, M, or S, indicates different cooking treatments including boiling, microwaving, and steaming. The last number after B, M, or S indicates the duration of the cooking method (mins).

