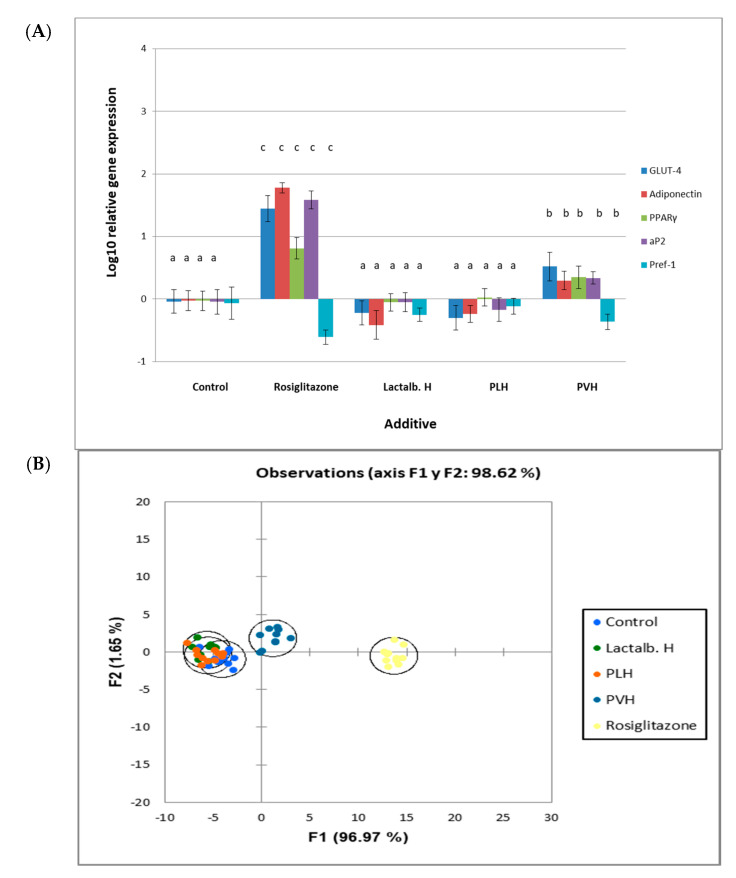
Figure 4.
Relative gene expression in 3T3-L1 cell cultures either non treated (control) or treated with rosiglitazone, lactalbumin hydrolysate (Lactalb. H), or pea legumin or vicilin hydrolysates (PLH or PVH, respectively). (A) Relative gene (glucose transporter 4 (GLUT4), adiponectin, peroxisome proliferator-activated receptor γ (PPARγ), adipocyte fatty acid-binding protein (aP2), pre-adipocyte factor-1 (Pref-1)) expression in 3T3-L1 cell cultures. Expression analysis was carried out by rt-PCR. Y axis represents log10 fold change. Data are means of 12 independent experiments with their SD in bars. a,b,c Bars with different superscript letters denote significant differences (p < 0.01). (B) Discriminant Analysis on data of gene expression results in 3T3-L1 cell cultures either non treated (control) or treated with rosiglitazone or hydrolysates (Lactalb. H, PLH, PVH). Differences between rosiglitazone or PVH with controls were significant (p < 0.01).

