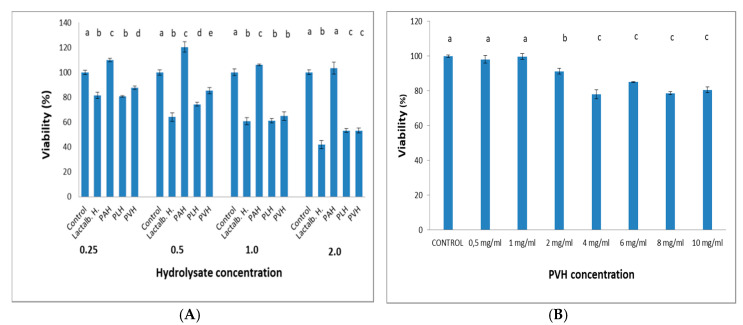
Figure 6.
(A) Viability of 3T3-L1 cells for 48 h in the presence of increasing concentrations (mg/mL) of Lactalb. H, PAH, PLH or PVH, and (B) viability of PVH in HCT116 cells. Data are means of 12 independent experiments with their SD in bars. a,b,c,d,e Bars with different superscript letters indicate significant differences (p < 0.05) with respect to control.

