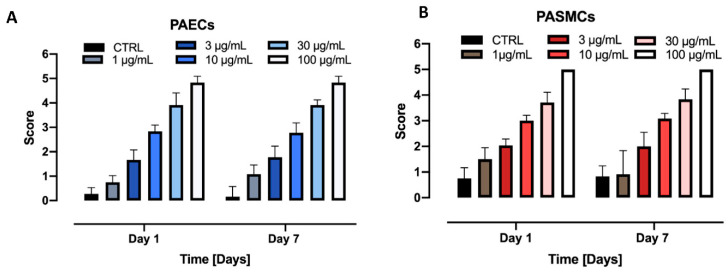
Figure 5.
Blind scoring of nanoMIL-89. Cells were treated with different concentrations of nanoMIL-89 (1, 3, 10, 30, 100 µg/mL) and imaged with inverted light microscope. Cellular uptake of nanoMIL-89 by (A) PAECs and (B) PASMCs was determined by blinded visual scoring (n = 6 independent assessments) according to a relative scale from 0 to 5.

