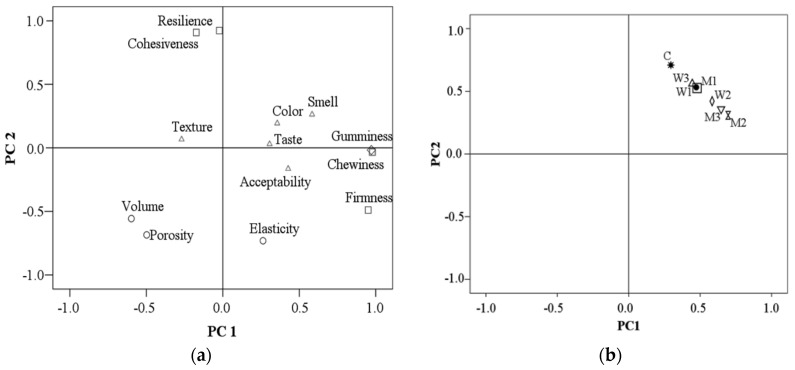
Figure 6.
Principal component analysis: (a) distribution of the physical, textural and sensory parameters analyzed; (b) distribution of bread samples in function of the analyzed parameters. C—control sample, M1—12.5% milk, M2—25% milk, M3—50% milk, W1—12.5% acid whey, W2—25% acid whey, W3—50% acid whey.

