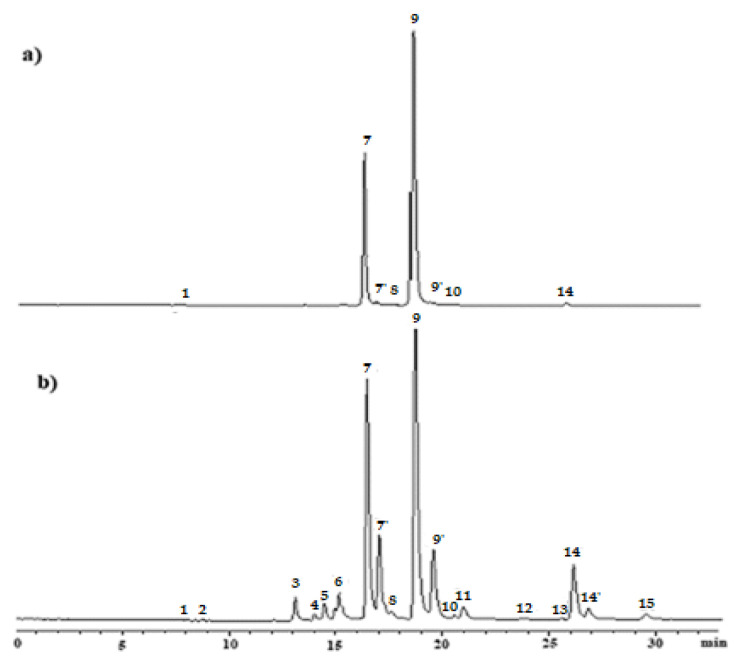
Figure 1.
HPLC chromatograms at 640 nm of pigment extracts from: (a) fresh fruits; (b) fruits after alkaline treatment (sample A). Peaks: (1) pheophorbide a; (2) pyropheophorbide a; (3) Mg-152-Me-phytyl-rhodin g7 ester; (4) 152-Me-phytyl-rhodin g7 ester; (5) Mg-152-Me-phytyl-chlorin e6 ester; (6) 152-Me-phytyl-chlorin e6 ester; (7) chlorophyll b; (7′) chlorophyll b’; (8) 132-OH-chlorophyll b; (9) chlorophyll a; (9′) chlorophyll a’; (10) 132-OH-chlorophyll a; (11) Mg-152-Me-phytyl-isochlorin e4 ester; (12) pheophytin b; (13) 152-Me-phytyl-isochlorin e4 ester; (14) pheophytin a; (14′) pheophytin a’; (15) pyropheophytin a.

