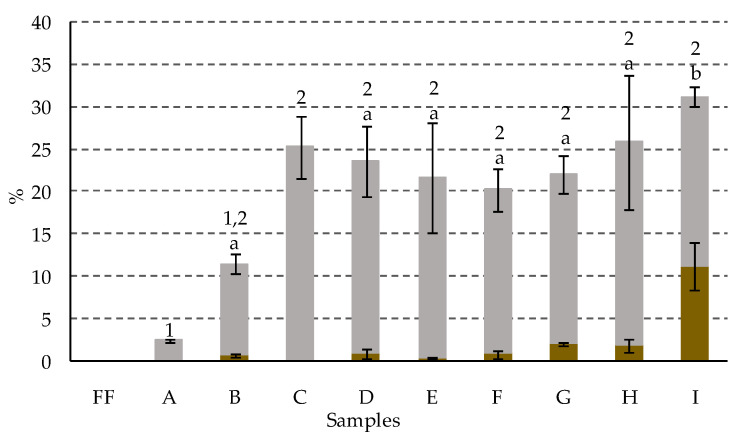
Figure 7.
Percentage composition (with respect to total chlorophyll content) of: (●) pyropheophorbide a; (●) pyropheophytin a, in green olives. Abbreviations: FF, fresh fruit; A–I: fruits with different alkaline treatments (see Table 1 for description of samples). Data represent mean values ± SD (n = 2). Different letters or numbers above the error bars indicate significant differences (for the lower and upper data set, respectively) according to the Duncan’s multiple-range test (p < 0.05).

