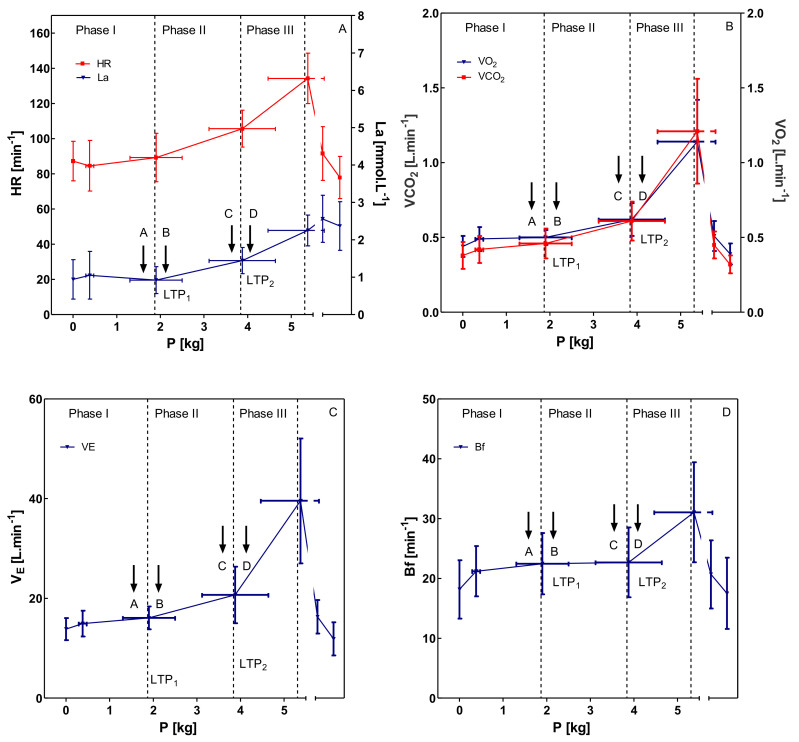
Figure 2.
All data are presented as mean ± SD, calculated from all participants. Selected variables (HR—heart rate; La—blood lactate concentration; VO2—oxygen uptake; VCO2—carbon dioxide output; VE—ventilation; Bf—breathing frequency) during an incremental bicep exercise test. Sub-maximal markers are the first and second lactate turn point. Exercise intensities for constant-load tests ((A)—5% of Pmax < LTP1; (B)—5% of Pmax > LTP1; (C)—5% of Pmax < LTP2; (D)—5% of Pmax > LTP2) and distinct phases (Phases I–II–III) are shown. Phase I: no increase in blood lactate concentration above baseline during constant-load exercise. Phase II: slight increase in blood lactate concentration. Phase III: strong increase of blood lactate concentration up to termination of exercise.

