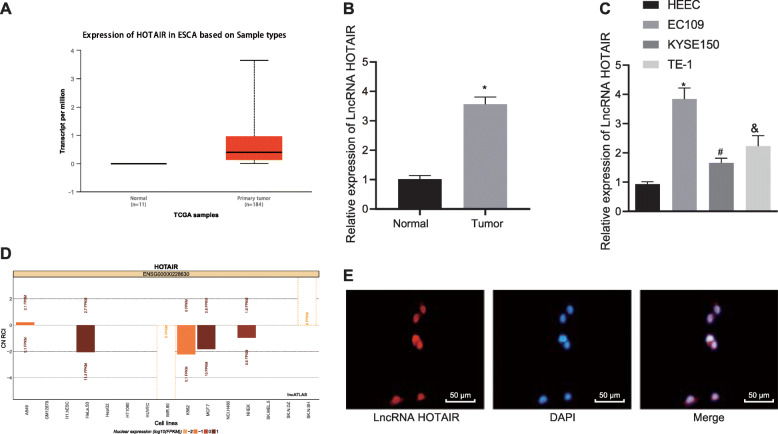
Fig. 2.
HOTAIR is upregulated in EC tissues and cell lines. a HOTAIR expression analyzed using the TCGA database. b HOTAIR expression in EC tissues (n = 70) and adjacent normal tissues (n = 70) determined by RT-qPCR, normalized to GAPDH. (C) HOTAIR expression in EC cell lines and HEEC determined by RT-qPCR, normalized to GAPDH. d The localization of lncRNA HOTAIR in TE-1 EC cells predicted using the subcellular location website (http://lncatlas.crg.eu/). e The localization of lncRNA HOTAIR in TE-1 EC cells verified using FISH assay (× 200). Values obtained from three independent experiments in triplicate are expressed as mean ± SD and analyzed using paired t test between EC tissues and adjacent normal tissues, and using unpaired t test between EC cells and HEEC cells. In panel b, * represents comparison with adjacent normal tissues, * p < 0.05. In panel c, * represents comparison with HEEC cells, * p < 0.05

