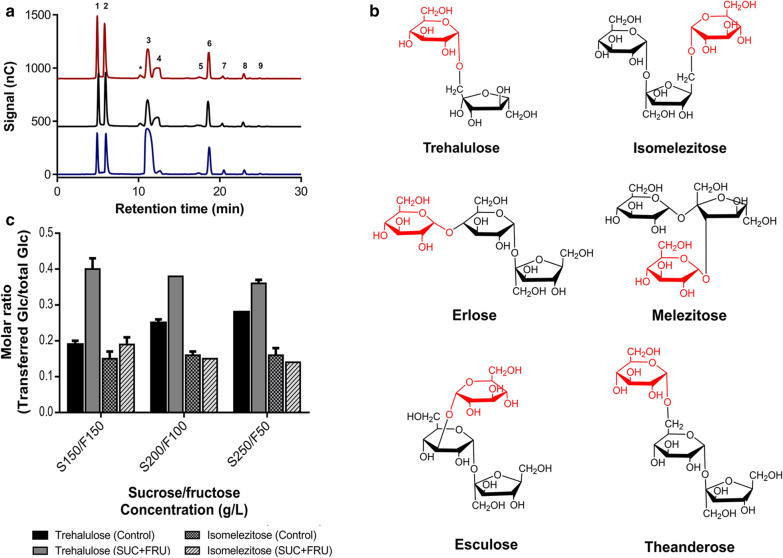
Fig. 5.
Representative HPAEC-PAD chromatogram of transglucosylation products synthesised in overload sucrose reactions. Chromatograms correspond to the sugar mixtures obtained by using M. reukaufii cell extract (blue line), Mr-αGlu (black line) or Mg-αGlu (red line) for about 71–76% sucrose conversion. Peaks assignation: (1) glucose, (2) fructose, (3) sucrose, (4) trehalulose, (5) melezitose, (6) isomelezitose, (7) theanderose, (8) erlose, (9) esculose, (*) non-identified peak (a). Chemical structures of the oligosaccharides synthesised by Metschnikowia yeasts α-glucosidases. The glucose unit transferred to free fructose or sucrose is represented in red (b). Molar ratio of glucose transferred to trehalulose or isomelezitose related to the total initial glucose. Reactions using different initial concentrations of sucrose plus fructose or sucrose (control reactions) were performed in triplicate. Standard errors are indicated (c)

