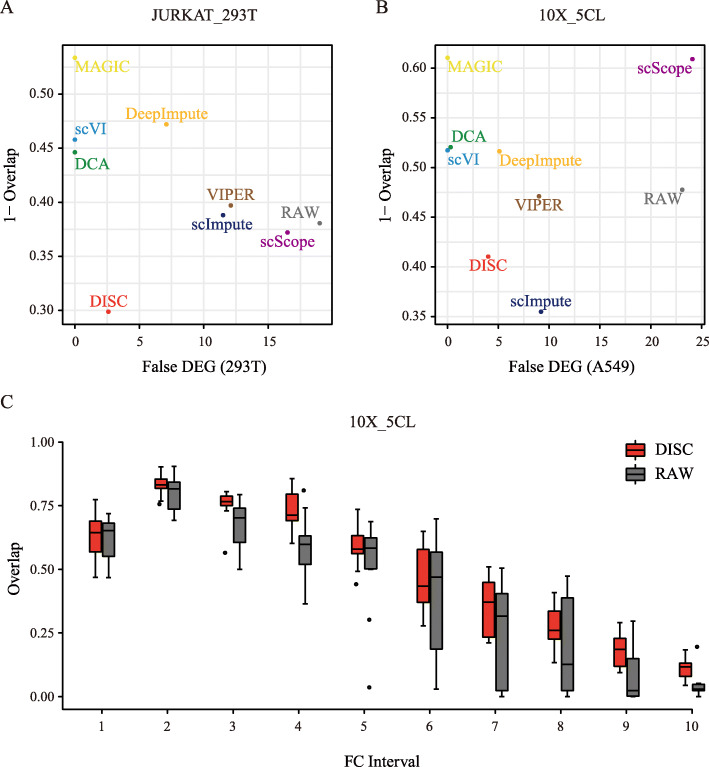
Fig. 6.
Evaluation of DEG identification. DEG was identified using MAST for a the JURKAT_293T dataset and b the 10X_5CL dataset, where x-axis shows the false number of DEGs identified from a homogeneous population (293T and A549 cell lines were used, respectively) and y-axis shows the averaged overlaps of DEGs identified by scRNA-seq data to that of bulk RNA-seq for all the combination of cell lines in the dataset. c For a pair of cell lines in the 10X_5CL dataset, genes were grouped into 10 intervals ranked by their FC values. For example, interval 1 is top 10% genes ranked by FC. The overlap between bulk and single-cell DEGs identified using MAST were calculated for 10 combinations of cell lines for each interval. Box plots show the median (center line), interquartile range (hinges), and 1.5 times the interquartile range (whiskers) for the 10 overlap values

