
Figure 2.
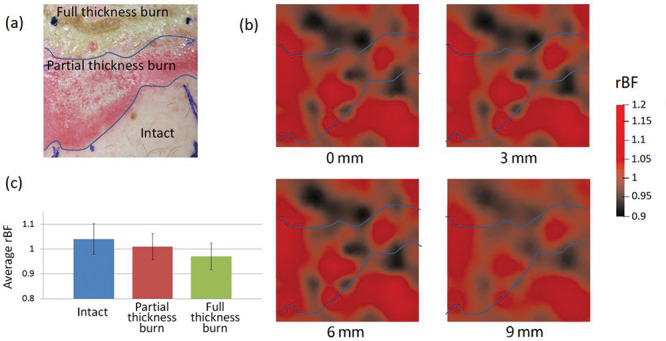
BF Distributions in Patient 1. (a) A photo of the selected ROI. (b) 2D cross-section views of rBF distributions at the depths of 0, 3, 6, and 9 mm. (c) A bar graph to show average rBF values in different tissue volumes. Error bars represent standard deviations.