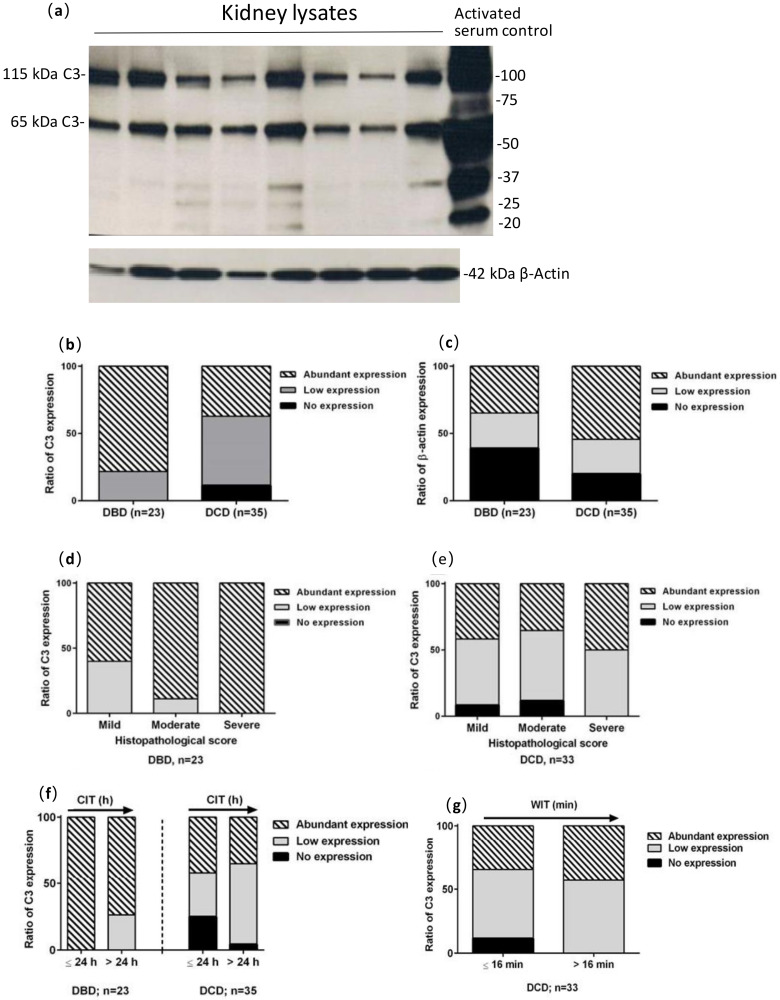
Figure 4.
Semi-quantitative analysis of complement C3 and β-actin in DBD and DCD kidneys. (a) An exemplary autoradiograph of Western blotting analysis of human kidney lysates showing two major bands for complement C3 (C3, 115 and 65 kDa) and lower weight C3 products in some samples (activated serum loaded for comparison). β-actin (42 kDa) reactivity was also revealed (lower part of figure); (b,c) semi quantitative analysis of C3 and β-actin in DBD and DCD kidneys; (d,e) C3 expression was plotted against histological score in DBD and DCD kidneys; (f,g) the expression of C3 in DBD and DCD kidneys plotted against CIT and WIT.

