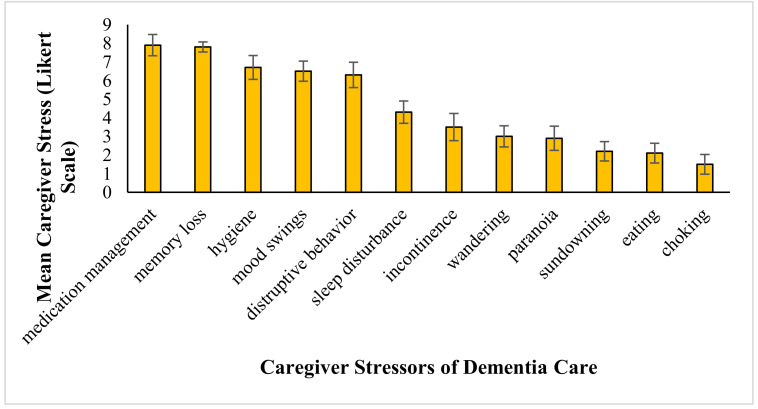
Figure 1.
Average caregiver stress (Likert scale) and frequency of behavior or issue. For each common behavior demonstrated by dementia patients, this graph shows how much stress it generates in interviewed caregivers (N = 15) and how common the behavior is. Values for the frequencies of the behaviors come from the literature. Error bars depict standard error of the means.

